Recasts, Backcasts, & Forecasts
The shape of our cities' stories and our progress along them
“The history of Studebaker has been linked inseparably with the history of South Bend in the same way as it has been linked with the history of transportation. As Studebaker has grown. South Bend has grown, and even a more brilliant future for both lies ahead. But with all the wonderful sales records, Studebaker, under Mr. Erskine's guidance has never lost sight of the ideals of the founders or the realization of its responsibilities. Traditions have always meant much to Studebaker and always will - and these offer assurance of a continuance of the same high standards that have characterized Studebaker's dealings with public and employee alike for nearly three-quarters of a century.”
Science | Progress | Finance | Commercial | Industrial | Transportation
1923
Kurt Vonnegut (an Indiana native) became known for his analytical take on the “shape of stories”. He explained that most stories can be charted on a simple two-dimensional graph. On the y-axis lies a scale from ill fortune to good fortune. The x-axis charts beginning to end. With humor, he reveals that most stories follow just a few shapes1.
Here is a great summary of the idea and some great graphics (below) of the different shapes and the historical examples they represent.
Morgan Housel defines all forecasts as “a number from today multiplied by a story about tomorrow.”
The intersection of entrepreneurship and economic development is full of these forecasts. Entrepreneurs, elected officials, and economic development professionals are all searching for the piece of data they can use as the genesis of a story that rallies people behind a better future.
History might be a forecast in reverse - a number from today multiplied by a story about yesterday. The interface between the stories we tell about history and the stories we tell about the future is a choice of Vonnegut’s shapes and where we find ourselves along it.
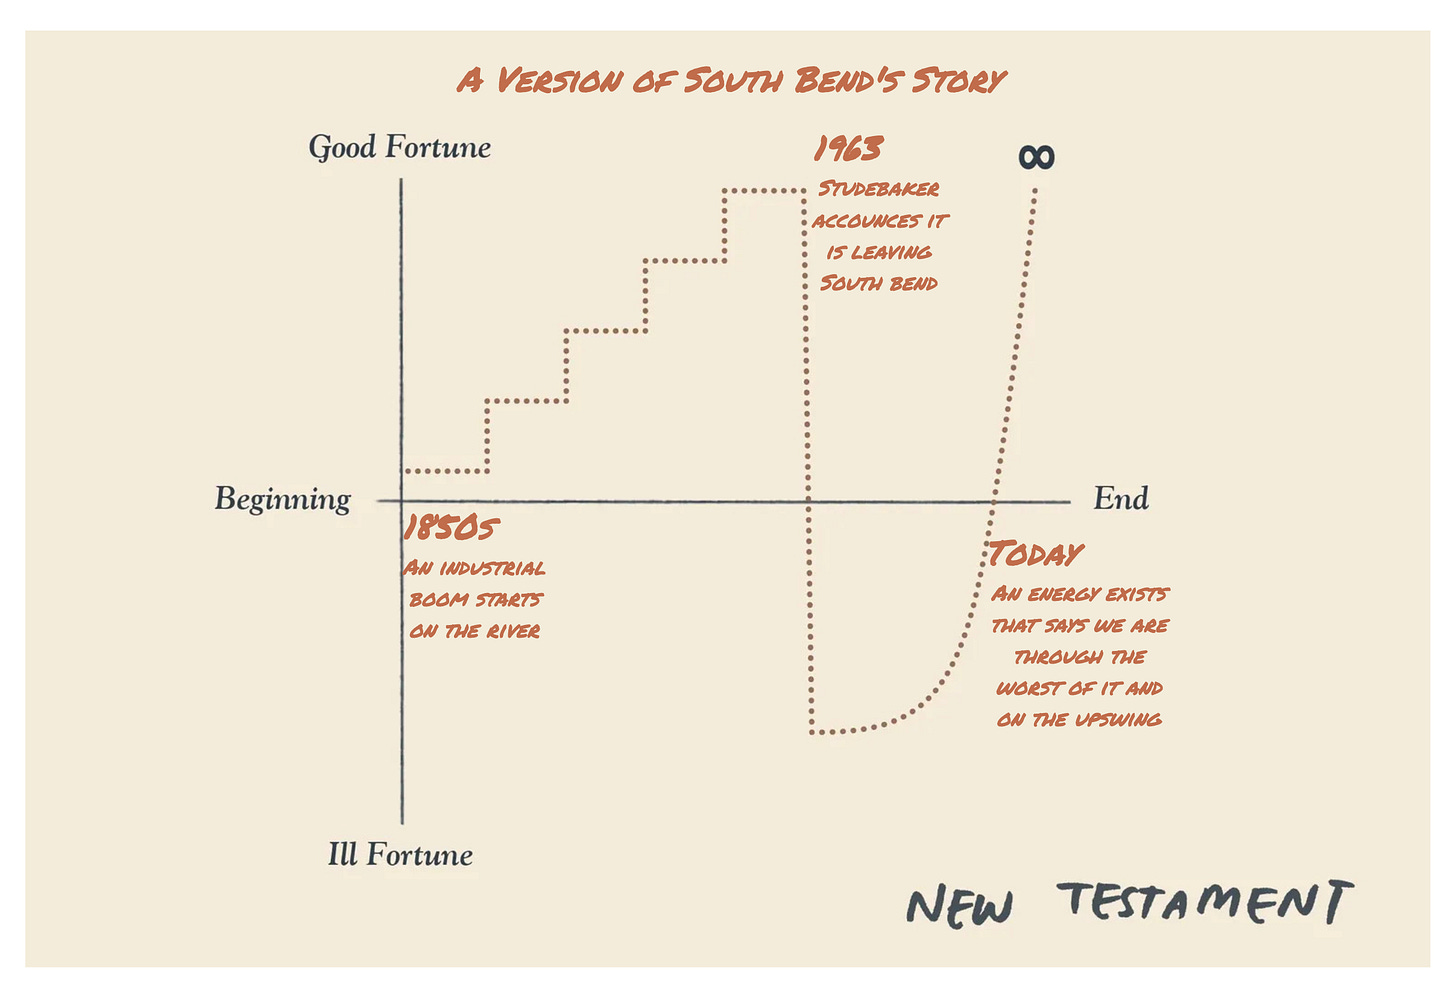
The last decade in South Bend has been backcasting a New Testament narrative, centered around a sharp decline in 1963 as Studebaker left town and an inflection point toward good fortune today.
The temptation about using this model is the illusion of an end state, and specifically, choosing the right shape and our place along it to end in ∞ good fortune. The reality is that a city’s story hardly every comes to an end. The shapes can be shrunk to fit a decade or expanded to represent a century. They can be placed end-to-beginning, recasting the past, present, and future. We often want to believe we are changing the shape or accelerating its timeline - sometimes both. We backcast our history to best fit forecasts of our future. And the “we” of a city is a complicated character. Are we all experiencing the same shape and progress along it?
No one wants to believe they are in From Bad to Worse, everyone wants to believe they are at the inflection point of Man in a Hole, Boy Meets Girl, Cinderella, or New Testament, and the reality often feels more like Which Way is Up?.
There are no real answers. Only stories. Backcasts about the past and forecasts about the future, constantly recast from their interface at the present.
But if we have a choice - if we are the authors - why not write something optimistic?
It’s interesting to see LLMs able to do just what he predicts in this talk from decades ago


